MTF Candle Multi HubMTF Candle Multi Hub Indicator - Guide 日本語解説は下記
Introduction
The "MTF Candle Multi Hub" indicator is a versatile and comprehensive tool designed to visualize multiple timeframes' candlestick data, Heikin Ashi candles, and moving averages on a single chart. This indicator also includes a Zigzag feature with the ability to draw horizontal lines at significant swing points, making it a powerful tool for technical analysis.
Key Features
Multi-Timeframe Candlestick Display:
The indicator allows you to display candlesticks from different timeframes, including 5-minute, 15-minute, 1-hour, 4-hour, daily, and weekly timeframes.
Each timeframe's candlestick can be toggled on or off using the settings panel.
Candlesticks are color-coded based on whether the close is higher or lower than the open, with customizable colors for bullish and bearish candles.
Heikin Ashi Candlesticks:
Heikin Ashi candlesticks are also available for 5-minute, 15-minute, 1-hour, 4-hour, daily, and weekly timeframes.
Like the standard candlesticks, these can be toggled on or off, and their colors are customizable.
Moving Averages (MA):
The indicator supports up to four different moving averages, which can be either Simple Moving Average (SMA) or Exponential Moving Average (EMA).
The user can toggle each moving average on or off and adjust the period and type from the settings panel.
An additional feature allows the space between two moving averages to be filled with a color, indicating the relative position of the MAs.
Zigzag Indicator with Horizontal Lines:
The Zigzag feature plots lines between significant swing highs and lows, helping identify trends and potential reversal points.
Two Zigzag lines can be configured, each with customizable swing length, line color, style, and width.
The indicator also offers the ability to draw horizontal lines at the start and end of each Zigzag swing. These horizontal lines can be customized in terms of color, style, width, and length.
The number of horizontal lines to be drawn can be set, allowing for focused analysis of the most recent swings.
Label and Comment Display:
The indicator provides the option to display custom labels and comments on the chart.
You can enter up to ten different comments, which will be displayed in a label at the last candlestick of the chart.
The label's position, background color, text color, and text size are fully customizable.
Trading Strategy
Trend Following with Multi-Timeframe Analysis:
Use the multi-timeframe candlestick and Heikin Ashi features to assess the trend across different timeframes. For example, if both the daily and 4-hour Heikin Ashi candles are bullish, it may indicate a strong uptrend.
Entry and Exit Signals:
Use the Zigzag indicator to identify potential entry points by looking for a new swing high or low.
Horizontal lines from the Zigzag can be used as support and resistance levels, helping to determine potential entry and exit points.
Moving Average Crossovers:
Monitor the crossovers of the moving averages. For example, when a shorter-term MA crosses above a longer-term MA, it may signal a potential buy opportunity.
Confluence of Signals:
The best trading opportunities may arise when multiple signals align. For example, a bullish Zigzag swing, supported by bullish Heikin Ashi candles and a moving average crossover, could provide a strong buy signal.
Disclaimer
For Educational Purposes Only: This indicator is provided for educational purposes and should not be used as the sole basis for any trading decisions.
No Guarantees: The indicator is provided "as is" without any guarantees of accuracy or completeness. Market conditions can change rapidly, and this indicator may not always reflect the most accurate market state.
Test Thoroughly: Bugs may exist in the script. It is highly recommended to test this script on a demo account before using it in live trading.
Use with Caution: Always use this indicator in conjunction with other analysis tools. Do not rely solely on this indicator for making trading decisions.
Sudden Changes or Removal: The indicator may be subject to sudden changes or removal without prior notice. The developer is not responsible for any issues this may cause.
By using this indicator, you agree to these terms.
MTF Candle Multi Hub インジケーター - ガイド
はじめに
「MTF Candle Multi Hub」インジケーターは、複数の時間枠のローソク足データ、平均足、移動平均線を1つのチャート上で視覚化するために設計された多用途かつ包括的なツールです。このインジケーターには、水平線を描画する機能を備えたジグザグ機能も含まれており、テクニカル分析において強力なツールとなります。
主な機能
マルチタイムフレームのローソク足表示:
5分足、15分足、1時間足、4時間足、日足、週足のローソク足を表示することができます。
各時間枠のローソク足は設定パネルでオンまたはオフに切り替えることができます。
ローソク足は、終値が始値より高いか低いかに基づいて色分けされており、強気と弱気のローソク足の色をカスタマイズできます。
平均足ローソク足:
5分足、15分足、1時間足、4時間足、日足、週足の平均足ローソク足を表示することができます。
標準のローソク足と同様に、これらをオンまたはオフに切り替え、色をカスタマイズすることが可能です。
移動平均線(MA):
このインジケーターは、単純移動平均線(SMA)または指数移動平均線(EMA)のいずれかを選択できる4つの移動平均線をサポートしています。
各移動平均線をオンまたはオフに切り替え、期間やタイプを設定パネルから調整できます。
また、2本の移動平均線の間に色を塗ることで、MAの相対的な位置を視覚的に表示する機能もあります。
ジグザグインジケーターと水平線:
ジグザグ機能は、重要なスイングの高値と安値の間に線を引き、トレンドや潜在的な反転ポイントを識別するのに役立ちます。
2本のジグザグラインを設定することができ、それぞれのスイングの長さ、線の色、スタイル、幅をカスタマイズできます。
また、ジグザグのスイングの始点と終点に水平線を描画する機能も提供されています。これらの水平線は、色、スタイル、幅、長さをカスタマイズできます。
描画する水平線の本数を設定でき、最新のスイングに焦点を当てた分析が可能です。
ラベルとコメントの表示:
インジケーターは、チャート上にカスタムラベルとコメントを表示するオプションを提供します。
最大10個の異なるコメントを入力することができ、これらはチャートの最新のローソク足にラベルとして表示されます。
ラベルの位置、背景色、テキストの色、テキストのサイズは完全にカスタマイズ可能です。
トレード戦略
マルチタイムフレーム分析を使用したトレンドフォロー:
マルチタイムフレームのローソク足や平均足の機能を使用して、異なる時間枠でのトレンドを評価します。例えば、日足と4時間足の平均足が共に強気であれば、強い上昇トレンドを示している可能性があります。
エントリーとエグジットシグナル:
ジグザグインジケーターを使用して、新たなスイング高値または安値を確認し、エントリーポイントを見極めます。
ジグザグの水平線をサポートおよびレジスタンスレベルとして使用し、エントリーやエグジットのタイミングを判断します。
移動平均線のクロスオーバー:
移動平均線のクロスオーバーを監視します。例えば、短期の移動平均線が長期の移動平均線を上抜けた場合、買いのシグナルとなる可能性があります。
シグナルのコンフルエンス:
複数のシグナルが一致する場合、最も良いトレード機会が生まれるかもしれません。例えば、強気のジグザグスイング、強気の平均足、移動平均線のクロスオーバーが揃うと、強力な買いシグナルとなる可能性があります。
免責事項
教育目的のみ: このインジケーターは教育目的で提供されており、トレードの決定を行う際の唯一の基準として使用すべきではありません。
保証なし: インジケーターは「現状のまま」提供されており、その正確性や完全性についての保証はありません。市場の状況は急速に変化する可能性があり、このインジケーターが常に最も正確な市場状況を反映するとは限りません。
十分なテストを: このスクリプトにはバグが存在する可能性があります。実際のトレードで使用する前に、デモ口座で十分にテストすることを強くお勧めします。
慎重に使用: このインジケーターを他の分析ツールと併用して使用してください。このインジケーターだけに頼ってトレードの決定を行うべきではありません。
突然の変更や削除の可能性: このインジケーターは予告なく変更や削除が行われる場合があります。そのため、利用者に不利益が生じる可能性がありますが、開発者はその責任を負いません。
このインジケーターを使用することで、これらの条件に同意したものとみなされます。
在腳本中搜尋"moving average crossover"

Filter Cross1. Indicator Name
Filter Cross Indicator
2. One-line Introduction
A multi-filtered crossover strategy that enhances classic moving average signals with trend, volatility, volume, and momentum confirmation.
3. General Overview
The Filter Cross indicator builds upon the traditional golden/dead cross concept by incorporating additional market filters to evaluate the quality of each signal. It uses two key moving averages (50-period and 200-period SMA) to identify crossovers, while adding four advanced metrics:
Linear regression trend ordering,
ATR-based volatility positioning,
Volume pressure,
Price positioning relative to fast MA.
These components are individually scored and averaged to calculate a Confidence %, which is displayed on the chart alongside each crossover signal. Visual cues such as dynamic color changes reflect the current trend direction and strength, making it intuitive for both novice and experienced traders.
The indicator is especially effective in swing trading and trend-following strategies, where false signals can be filtered out through the additional logic.
Security measures are applied to ensure that the core logic remains protected, making it safe for proprietary use.
4. Key Advantages
✅ Multi-factor Signal Validation
Evaluates each signal using four key market filters to improve reliability over classic crossovers.
📉 Confidence Score Display
Each signal is accompanied by a Confidence % label to help traders assess entry/exit quality.
🎨 Dynamic Color Feedback
Automatically adjusts chart color based on trend intensity and direction, aiding visual clarity.
🔍 Linear Regression Trend Logic
Uses pairwise comparison of regression data to quantify trend alignment across lookback periods.
📈 Reduced False Signals
Minimizes noise and weak signals during sideways markets using adaptive thresholds.
📘 Indicator User Guide
📌 Basic Concept
Filter Cross enhances moving average crossover signals using four additional market-based filters.
These include trend alignment, volatility range, volume strength, and price momentum.
Final signals are graded with a Confidence % score, showing how favorable the conditions are for action.
⚙️ Settings Explained
Fast MA Length: Short-term moving average period (default: 50)
Slow MA Length: Long-term moving average period (default: 200)
Linear Regression Length: Period used to assess price trend alignment
Trend Lookback / Threshold: Sensitivity controls for trend scoring
Volume Lookback / ATR Length: Defines volatility and volume filters
Bull/Bear Color: Customize visual colors for bullish and bearish signals
📈 Buy Timing Example
Golden Cross occurs (50 MA crosses above 200 MA)
Confidence % is above 70%
Trend color turns green, volume is rising, price above fast MA → Strong entry signal
📉 Sell Timing Example
Dead Cross occurs (50 MA crosses below 200 MA)
Confidence % above 60% indicates a reliable bearish setup
Regression trend down, color turns red → Valid exit or short opportunity
🧪 Recommended Use Cases
Combine with RSI or MACD for timing confirmation in swing trades
Use Confidence % to filter out weak crossover signals during sideways trends
Effective in medium-to-long term trading with volatile assets
🔒 Precautions
Confidence % reflects current conditions—not future prediction—use with discretion
May produce delayed signals in ranging markets; test before real application
Best results achieved when combined with other indicators or price action context
Always optimize parameters based on the specific market or asset being traded
+++

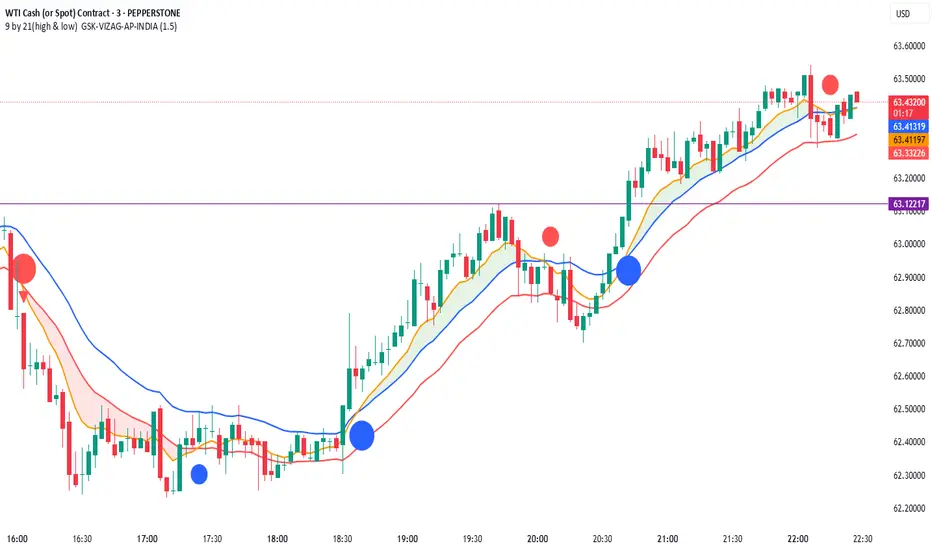
9 by 21(high & low) GSK-VIZAG-AP-INDIA21 EMA High & Low + 9 EMA Crossover with Volume & Wick Confirmation
🔹 What Does This Indicator Do?
This indicator is designed for momentum-based trend trading by combining exponential moving averages (EMAs), price action filters, and volume analysis. It provides traders with high-probability buy and sell signals while filtering out weak trends and false breakouts.
🔹 How Is It Different from Other Indicators?
Unlike traditional EMA crossover strategies that rely only on moving averages, this indicator enhances reliability by incorporating custom volume conditions, price action validation, and wick-based filtering.
Key Features That Make It Unique:
Dynamic EMA Bands for Trend Identification
Uses 21 EMA High & 21 EMA Low as dynamic support & resistance levels, creating a flexible trading range.
Helps traders identify trend strength and potential reversals without relying on static levels.
Enhanced EMA Crossover System
Includes a 9 EMA crossover signal to detect momentum shifts before traditional EMAs react.
Avoids lagging signals often seen in standard moving average crossovers.
Smart Volume-Based Confirmation
Uses a custom volume multiplier to detect significant market participation.
Filters out low-volume breakouts that may lead to false signals.
Wick-Based Filtering for Precision
Identifies candles with no lower wick (for buy signals) and no upper wick (for sell signals) to confirm strong price movements.
Helps traders avoid weak reversals and focus only on strong momentum shifts.
🔹 How to Use This Indicator in Trading?
Buy Conditions:
Bullish candle (green) with no lower wick, confirming strong buying pressure.
Price is above the 21 EMA High and remains above 21 EMA Low.
Volume shows an increase, confirming market participation.
Sell Conditions:
Bearish candle (red) with no upper wick, signaling strong selling pressure.
Price is below the 21 EMA Low and remains under the 21 EMA High.
Volume confirms strong momentum in the downward direction.
Bonus: The indicator also highlights 9 EMA & 21 EMA crossovers to provideearly trend confirmations.
Who Should Use This Indicator?
✅ Intraday Traders – Looking for quick entry and exit signals based on price momentum.
✅ Swing Traders – Who want to identify medium-term trend shifts with volume confirmation.
✅ Trend Followers – Seeking a robust moving average system to avoid false breakouts.
✅ Momentum Traders – Who need price-action-based confirmation before taking a trade.
Why This Indicator Stands Out?
Unlike standard EMA-based indicators that often generate false breakouts, this tool:
✔️ Filters low-quality signals using smart volume analysis.
✔️ Enhances trend confirmation with wick-based filtering.
✔️ Detects momentum early using a unique EMA crossover combination.
This makes it more reliable than traditional moving average-based systems and highly adaptable for different market conditions.
Note: The logic behind this indicator is proprietary and non-repainting, making it a powerful tool for traders who rely on EMA-based trend strategies.
Try it out and see how it improves your trading decisions!
Why This Description Works?
✔ No code exposure – The logic is explained in concept but not in detail.
✔ Clear differentiation – Shows why this is better than other indicators.
✔ Compliant with TradingView rules – No vague claims, but precise explanations.
Would you like to add any specific trading examples or screenshots to further enhance it? Let me know!
Share Your Experience!
Your feedback is valuable! If you find this indicator useful, leave a comment with your experience—how it worked for you, any improvements you suggest, or the best settings you discovered.
Let’s build a community of traders refining strategies together!
Disclaimer:
This indicator is for educational and informational purposes only. It does not guarantee profitable trades and should be used with proper risk management. Always conduct your own research before making trading decisions.
AmirSoraya_Bar_Painting_IndicatorThe "AmirSoraya_Bar_Painting_Indicator" is a comprehensive Pine Script indicator designed for the TradingView platform. It aims to enhance chart analysis by painting bars based on various technical filters, including internal bar strength (IBS), body range, overlap, and volatility breakout conditions. Additionally, it includes features for detecting climax bars, close comparisons, moving average crossovers, and more. This guide will walk you through the indicator's features, settings, and how to use it effectively.
Features
Bar Painting:
Bullish/Bearish Strong and Normal Bars: Paints bars based on IBS, body range, and overlap filters.
Doji Bars: Highlights doji bars where the open and close prices are the same.
Overlapped Bars: Highlights bars with significant overlap with the previous bar.
Climax Bars:
Detects and marks climax bars based on user-defined factors.
Separate settings for strong and normal bars.
Close Comparison:
Analyzes close prices over a specified number of bars.
Highlights bullish or bearish conditions based on close price comparisons.
Moving Average Crossovers:
Plots two EMAs and signals crossovers.
Customizable lengths and colors.
Volatility Breakout:
Uses ATR to determine and mark breakout bars.
Separate thresholds for bullish and bearish breakouts.
First Hour Background:
Marks the first hour high/low range with a customizable background.
Take Profit and Stop Loss Levels:
Plots TP and SL levels based on ATR for strong and normal bars.
Panel Display:
Displays ATR, Stop Loss, Pip Value, and Bar Range information in a panel.
Micro Gaps:
Detects micro gaps and attempts to mark reversal attempts.
The "AmirSoraya_Bar_Painting_Indicator" is a versatile tool that provides detailed insights into price action through advanced bar painting techniques. By customizing the various filters and settings, traders can tailor the indicator to suit their specific trading strategies. Use this guide to understand and make the most out of the indicator's features for improved chart analysis and trading decisions.

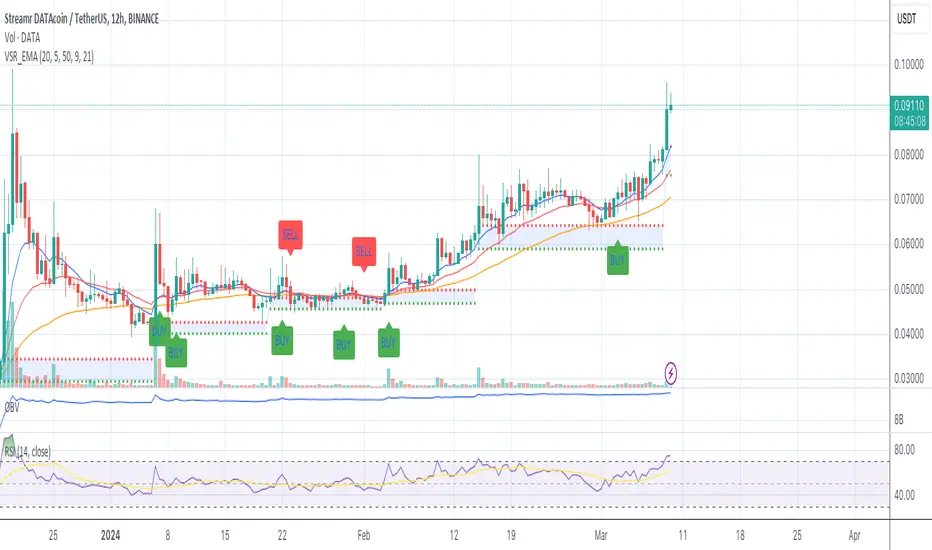
Volume Based S/R with EMA Crossover SignalsThis Pine Script indicator, titled "Volume Based S/R with EMA Crossover Signals," is designed for use on the TradingView platform and overlays on price charts to help traders identify potential buy and sell opportunities based on volume changes and EMA (Exponential Moving Average) crossovers. Let's break down its components for a detailed understanding:
Inputs
length: The number of bars used to calculate the standard deviation of the volume change. This parameter helps in identifying significant changes in volume over a specified period.
threshold: A multiplier applied to the standard deviation of volume change to determine significant spikes in volume, which are then used to identify support and resistance levels.
smoothLength: The length of the EMA used to smooth the price data, providing a clearer view of the overall price trend and helping to confirm trade signals.
fastEMALength and slowEMALength: The lengths of the fast and slow EMAs, respectively. These are used to generate crossover signals, where the crossing of the fast EMA over the slow EMA may indicate a potential entry or exit point.
Calculations
Volume Change and Standard Deviation: The script calculates the percentage change in volume from one bar to the next and then computes the standard deviation of these changes over the specified length. This process helps identify unusual volume activity, which can precede significant price movements.
Signal Generation Based on Volume: When the absolute value of the volume change divided by its standard deviation exceeds the threshold, it signals significant volume activity, potentially indicating strong support or resistance levels at previous highs or lows.
Smoothed Price: An EMA applied to the closing prices over smoothLength bars helps to confirm the trend direction and filter out noise.
EMA Crossover Signals: The script calculates two EMAs based on the fastEMALength and slowEMALength inputs. A crossover of these two averages generates potential buy or sell signals.
Logic for Buy/Sell Signals
Buy Signal: Generated when the price is above the identified support level (determined by significant volume activity), the fast EMA crosses above the slow EMA, and the price is also above the smoothed price. This confluence of conditions suggests upward momentum and potential buying opportunity.
Sell Signal: The opposite conditions generate a sell signal — when the price is below the identified resistance level, the fast EMA crosses below the slow EMA, and the price is below the smoothed price, indicating downward momentum and a potential selling opportunity.
Plotting
Support and Resistance Levels: Plotted as circles on the chart, with resistance levels in red and support levels in green, based on significant volume activity.
Smoothed Price and EMAs: The smoothed price line and both EMAs are plotted on the chart to help visually assess the trend and the crossover signals.
Buy and Sell Signals: Represented by shapes plotted on the chart, indicating the recommended trading action (buy or sell) based on the combined indicator logic.
Filling Between Support and Resistance: For visual clarity, the area between the identified support and resistance levels is filled, highlighting the range within which the price is expected to fluctuate.
This indicator offers a multi-faceted approach to trading, combining volume analysis with trend following via EMA crossovers. By identifying significant volume-based support and resistance levels and confirming trend direction with EMA crossovers and smoothed price trends, traders can make more informed decisions regarding entry and exit points. However, it's important to use this indicator as part of a comprehensive trading strategy, considering other factors such as market conditions, news, and technical analysis from other indicators.
HabibiTrades Pro System Strategy Overview
This strategy uses the following conditions:
WMA Crossover: To determine the direction of the market trend.
ADX: To confirm whether the trend is strong enough for trade.
Volume Spike: To validate the trade signal with increased market participation.
Let's break down each component and its role in the strategy.
1. WMA (Weighted Moving Average) Crossover:
The WMA is a type of moving average that gives more weight to recent prices. In this strategy, we use two WMAs:
Fast WMA (short period): Reacts quicker to price changes.
Slow WMA (long period): Reacts slower to price changes.
How it works:
Bullish Entry (Long): The Fast WMA crosses above the Slow WMA, indicating a potential upward price movement (bullish trend).
Bearish Entry (Short): The Fast WMA crosses below the Slow WMA, indicating a potential downward price movement (bearish trend).
2. ADX (Average Directional Index):
The ADX measures the strength of a trend, regardless of whether the trend is up or down.
How it works:
ADX > 20: Indicates a strong trend (either bullish or bearish). This is the threshold for considering a trade.
ADX > 30: Indicates an even stronger trend and is used to indicate high confidence in the trend direction.
3. Volume Spike:
Volume is an important indicator that tells you how much trading activity is happening in the market. A volume spike occurs when the current volume is significantly higher than the average volume over a specified period.
How it works:
Volume Spike Condition: The current volume is compared to the average volume (SMA). If the current volume is greater than the Volume SMA multiplied by the Volume Multiplier, a volume spike is detected.
Volume spikes are used to validate the strength of the trend and increase the likelihood that the trade signal is meaningful.
Strategy Logic
Long Entry Conditions (Buy Signal):
WMA Crossover: The Fast WMA crosses above the Slow WMA (bullish signal).
ADX: The ADX is above 20 (indicating a strong trend).
Volume Spike: The current volume is higher than the Volume SMA multiplied by the Volume Multiplier, confirming market participation.
Short Entry Conditions (Sell Signal):
WMA Crossover: The Fast WMA crosses below the Slow WMA (bearish signal).
ADX: The ADX is above 20 (indicating a strong trend).
Volume Spike: The current volume is higher than the Volume SMA multiplied by the Volume Multiplier, confirming market participation.
Exit Conditions:
Trailing Stop: A trailing stop is used based on the highest price for long trades or the lowest price for short trades since the entry. The position is exited when the price moves against the trade by a set amount (in ticks).

Waldo RSI :oWaldo RSI :o Indicator Guide
The Waldo RSI :o indicator is designed to complement the "Waldo RSI Overlay :o" by providing an RSI-based analysis on TradingView, focusing on macro shifts in market trends. Here's a comprehensive guide on how to use this indicator:
Key Features:
RSI Settings:
RSI Source: Choose from ON RSI, ON HIGH, ON LOW, ON CLOSE, or ON OPEN to determine how RSI calculates pivots.
RSI Settings:
Source: Default is (H+L)/2, but you can select any price for RSI calculation.
Length: Default RSI length is 7, which can be adjusted for sensitivity.
Trend Lines:
Show Trend Lines: Option to display trend lines based on RSI pivot points.
Zigzag Length: Determines pivot point sensitivity.
Confirm Length: Validates pivot points (default is 3).
Colors: Customize colors for Higher Highs (HH), Lower Highs (LH), Higher Lows (HL), and Lower Lows (LL) on the RSI.
Label Size and Line Width: Adjust the appearance of labels and lines.
Divergences:
Classic Divergences:
Show Classic Div: Toggle to reveal divergences where RSI and price move in opposite directions.
Colors: Set different colors for bullish and bearish divergence indicators.
Transparency and Line Width: Control the visual impact of divergence signals.
Hidden Divergences:
Similar settings for identifying hidden divergences, suggest trend continuation.
Breakout/Breakdown:
Show Breakout/Breakdown: Generates signals for RSI breakouts or breakdowns, used by "Waldo RSI Overlay :o" for visual chart signals.
Overbought/Oversold Zones:
Show Overbought and OverSold Zones: Highlights when RSI goes above 70 (overbought) or below 30 (oversold).
Moving Averages on RSI:
The default Moving Average (MA) settings are tailored to capture macro shifts in market trends:
Show Moving Averages: Option to overlay two MAs on the RSI for trend confirmation:
Fast RSI MA:
RSI Period: 50 (this is the period over which the RSI is calculated).
MA Length: 50 (the number of periods used for the moving average of the RSI).
Slow RSI MA:
RSI Period: 50 (same as fast for consistency in RSI calculation).
MA Length: 200 (longer term for capturing broader trends).
Crossover Signals: The RSI changes color from red to green based on these moving average crossovers:
When the Fast MA (50 period) crosses above the Slow MA (200 period), the RSI turns green, indicating potential bullish conditions or momentum shift.
Conversely, when the Fast MA crosses below the Slow MA, the RSI turns red, suggesting bearish conditions or a shift back towards a downtrend.
This 50-period RSI crossover setting is used to identify overall macro shifts in the market, providing a clear visual cue for traders looking at longer-term trends.
Ghost Lines (Optional):
Ghost Lines: Option to limit how far RSI trend lines extend, helping to keep the chart less cluttered.
How to Use the Indicator:
Setup:
Configure RSI by choosing the source and setting the length to match your trading style.
Set the zigzag and confirm lengths for appropriate pivot detection.
Trend Analysis:
Monitor the RSI for trend changes using the colored trend lines and labels.
Divergence Detection:
Look for RSI and price divergences to anticipate potential reversals or continuations.
Breakout/Breakdown:
Use these signals in conjunction with "Waldo RSI Overlay :o" for price action confirmation.
Overbought/Oversold:
Identify when the market might be due for a correction or continued momentum.
Moving Averages:
Focus on the color changes in RSI to understand macro trend shifts with the default 50/200 period setup.
Ghost Lines:
Enable for a cleaner chart if you don't need trend lines extending indefinitely.
Usage Tips:
Combine with other indicators for confirmation, as no single tool is foolproof.
Adjust settings to suit different market conditions or trading timeframes.
Use in tandem with "Waldo RSI Overlay :o" for a full trading signal system.
Remember, trading involves significant risk, and historical data does not guarantee future performance. Use this indicator as part of a broader trading strategy.

Sniper Entry using RSI confirmationThis is a sniper entry indicator that provides Buy and Sell signals using other Indicators to give the best possible Entries (note: Entries will not be 100 percent accurate and analysis should be done to support an entry)
Moving Average Crossovers:
The indicator uses two moving averages: a short-term SMA (Simple Moving Average) and a long-term SMA.
When the short-term SMA crosses above the long-term SMA, it generates a buy signal (indicating potential upward momentum).
When the short-term SMA crosses below the long-term SMA, it generates a sell signal (indicating potential downward momentum).
RSI Confirmation:
The indicator incorporates RSI (Relative Strength Index) to confirm the buy and sell signals generated by the moving average crossovers.
RSI is used to gauge the overbought and oversold conditions of the market.
A buy signal is confirmed if RSI is below a specified overbought level, indicating potential buying opportunity.
A sell signal is confirmed if RSI is above a specified oversold level, indicating potential selling opportunity.
Dynamic Take Profit and Stop Loss:
The indicator calculates dynamic take profit and stop loss levels based on the Average True Range (ATR).
ATR is used to gauge market volatility, and the take profit and stop loss levels are adjusted accordingly.
This feature helps traders to manage their risk effectively by setting appropriate profit targets and stop loss levels.
Combining the information provided by these, the indicator will provide an entry point with a provided take profit and stop loss. The indicator can be applied to different asset classes. Risk management must be applied when using this indicator as it is not 100% guaranteed to be profitable.
Goodluck!

[CP]Pivot Boss Multi Timeframe CPR Inception with MACD and EMAINTRODUCTION:
This indicator combines multi-timeframe CPR bands with MACD Momentum and EMA trend, all projected on the candlestick chart through a novel visualization.
If you have seen my other indicators on TradingView, you would know that I use floor pivots a lot and “Secrets of a Pivot Boss” is my favorite book. While using floor pivots, time and again I have noticed an interesting price behavior,
Trending moves in price typically start from around the Central Pivot Range (CPR). The CPR could be from ANY timeframe. These moves can easily be caught using simple momentum and trend indicators like MACD and EMA crossovers.
Yes, it is that simple. Follow along to understand how to use this indicator.
INDICATOR SETTINGS:
RANGEBOUND MACD AND EMA MARKINGS:
TradingView limits the max number of labels that can be shown on a chart to 500. Therefore, if you go far back enough, you won't see any markings for the MACD or EMA setups. If you are looking to test the efficacy of this indicator in the past, change the start and end dates to your desired timeframe and then select the ‘Mark MACD and EMA Setups in Range?’ option.
MULTI TIMEFRAME CENTRAL PIVOT RANGE:
Here you can select CPRs and their bands from which timeframes are shown on the chart. I will share my favorite settings later in this description.
CPR CONFIGURATION:
Show CPR Labels: CPRs markings can carry labels, so that you don’t confuse between which line is what. Use this setting to toggle them On/Off.
Show Next Time Period Pivots: Check this option if you want to see the CPR of the next time period. This is typically done to figure out the ’Two Day CPR Relationship’ . Read the book, “Secrets of a Pivot Boss”, to understand more.
EMA TREND:
Show EMA on the Chart: EMAs will be plotted on the chart. Standard stuff.
Mark EMA Crossovers on Chart: EMA crossovers will be marked on the chart in diamond shapes. If you are using EMA crossovers, I recommend setting this option to True.
Rest of the EMA settings are fairly obvious.
MACD MOMENTUM:
Projecting MACD parameters directly on the candlesticks is surely going to give you a new perspective about price action and MACD.
Also, in order to better understand the MACD projections on the chart, you can add a standard MACD indicator on the chart with default settings to figure out what my indicator is actually showing you.
Marking MACD Crossovers on Chart: Marks the MACD signal crossovers on the chart. This visualization was a game changer for me.
Show MACD Histogram on Chart: Projects the complete MACD Histogram in a novel fashion (Try it!). You will be able to visually see the ebbs and flow of momentum in the charts.
Mark MACD Histogram Peaks on Chart: Marks only the MACD peaks instead of the complete histogram. Peaks are a great way to enter an ongoing trend and to play an intraday rangebound market.
Rest of the settings are just the standard settings that you will find in a typical MACD indicator.
ALERTS:
Not shown in the settings panel, but I have added alerts for EMA and MACD Crossovers so that you don’t have to sit in front of the charts or constantly check the price all day long.
If you don’t know how to set alerts in TradingView, then please Google it.
INDICATOR USAGE EXAMPLES:
This indicator can be used in intraday as well as in higher timeframes.
There are quite a few variations possible, I personally prefer to use the EMA crossovers in intraday (5m) and MACD on Daily timeframes.
This is just a matter of personal preference, some people might prefer using EMAs only or MACD only in all timeframes.
Here are my personal settings for the intraday 5-minute timeframe:
Turn on all the CPR pivots starting from Yearly all the way to Daily. You can turn on 6 hourly and 4 hourly as well if you want.
Hourly CPR is mostly used when the price is in a strong trend and you missed the entry and don’t know when to enter. Price will typically experience pullbacks towards the Hourly CPR, before resuming in the direction of the trend. That is your chance to hop onto the bandwagon.
For Intraday, I keep the Bands off. Just a personal preference here.
You can turn ON the Show CPR Labels , if you want.
Turn ON both the options in the EMA TREND section. You would want to see the EMA crossovers marked on the chart as well as the EMAs themselves, as the distance between the two EMAs will give you an idea about the strength of the trend.
Keep rest of the settings in the EMA section as default (you can change the colors if you wish). I keep the same EMAs as the ones kept in the MACD indicator. I like to keep things simple.
In the MACD MOMENTUM section, turn ON Mark MACD Histogram Peaks on Chart and all the other options turned OFF. Leave the other settings as default. By the way, these are the default settings of the standard MACD Indicator.
You can set up EMA Bullcross and Bearcross alarms if you like.
Before checking out the examples, remember one super simple rule:
SOME OF THE BEST TRENDING MOVES IN THE MARKET, BE IT INTRADAY OR OTHERWISE, ORIGINATE IN THE VICINITY OF A LARGER TIMEFRAME PIVOT/CPR.
Look for price settling above/below a pivot, and then a move away from the pivot in any direction is typically a trending move.
You can use hourly pivots or MACD Histogram peaks marked on the chart to enter an existing trend, or add to your positions.
Let’s have a look at a few recent intraday examples from the Crypto, Indian, and US equity markets.
I have added my comments in the charts to make you easily understand what is going on.
Understand that both, moving average crossover and MACD, will give out a lot of signals (chop) every day. But almost 70% of them are going to be fake signals. It is the signals that you get when the price is near a Pivot, that tend to convert into gorgeous trending moves that last.
BTC 5m Charts
NIFTY Futures 5m Charts (good intraday trends are hard to find here, as the market is very efficient)
TSLA 5m Charts
Some important points for using this indicator in higher timeframes:
For higher timeframes, my personal preference is to go with the MACD indicator. I personally find MACD to be lethal on daily and weekly timeframes, if you know how to use it well.
The default settings of the indicator are the settings I use for both, Daily and Weekly, timeframes. Additionally, I turn off the CPR labels.
In theory large trending moves still have a big probability to start near an important pivot level, however, in larger timeframes, trending moves can start from anywhere. They need not start in the vicinity of any important pivot (but they often do!).
Weekly pivots can act as great pullback levels when the price is in strong momentum, when trading on the daily timeframe.
Quarterly Pivots act as great pullback levels when the price is in strong momentum, when trading on the weekly timeframe.
BTC Weekly Chart
BTC Daily Chart
Nifty Weekly Chart
Nifty Daily Chart
NASDAQ Weekly Chart
NASDAQ Daily Chart
FINAL WORDS:
Please understand that I have Cherry Picked the examples to showcase the capability of the indicator and its usage.
DO NOT conflate the accuracy of examples with the accuracy of this indicator.
Biggest catch is the fact that this indicator, like every other indicator out there, will have whipsaws. Some I have also marked in the example charts.
You need to come up with your own technique to avoid whipsaws, one technique I have shared here…… big moves typically start near pivots.
Work on avoiding whipsaws and finding you own edge in the markets.
If you really want to learn how to use Pivots, read the book ’Secrets of a Pivot Boss’ . This book can change your life.

hector mena Breakout Trading with ATR, RSI and MA CrossTitle: Breakout Trading Strategy with ATR, RSI, and Moving Average Cross
Description (English):
This script combines key technical indicators—ATR (Average True Range), RSI (Relative Strength Index), and Moving Averages—to provide a comprehensive breakout trading strategy. It is designed to help traders identify significant breakout levels and confirm signals with momentum and trend analysis.
How It Works:
ATR for Breakout Levels:
The ATR is used to calculate dynamic breakout levels by adjusting the highest resistance and lowest support levels with a customizable multiplier. This ensures that breakout levels adapt to market volatility.
RSI for Momentum Confirmation:
The RSI identifies overbought and oversold conditions, providing an additional layer of confirmation for breakouts. A breakout accompanied by an RSI signal can indicate stronger momentum.
Moving Average Cross for Trend Validation:
Two simple moving averages (short-term and long-term) are included to validate the trend. A crossover suggests a potential change in trend, aligning with breakout signals.
Why Combine These Indicators?
The ATR ensures breakout levels are realistic and volatility-adjusted.
The RSI avoids false signals by confirming if the price has momentum during a breakout.
Moving Average crossovers add trend-following confirmation, helping traders align with market direction.
The combination provides a robust framework to filter out false signals and improve the reliability of trading decisions.
Key Features:
Breakout Levels: Upper and lower breakout levels dynamically calculated using ATR.
RSI Confirmation: Visual overbought (70) and oversold (30) levels and RSI plot.
Trend Validation: Short and long-term moving averages plotted on the chart with crossover signals.
Visual Alerts: Clear "BUY" and "SELL" labels for actionable signals.
Custom Alerts: Configurable alerts for breakouts and moving average crossovers.
How to Use It:
Adjust the parameters (ATR length, multiplier, RSI length, and moving averages) based on your trading strategy.
Look for "BUY" signals when:
Price breaks above the resistance level, and RSI indicates oversold conditions.
Moving averages cross bullishly.
Look for "SELL" signals when:
Price breaks below the support level, and RSI indicates overbought conditions.
Moving averages cross bearishly.
Use alerts for automated notifications about potential trades.
Notes:
This script is intended for educational purposes. Use it alongside proper risk management techniques and backtesting.
Always test in demo mode before applying it to live trading.

UM EMA SMA WMA HMA with Directional Color ChangeUM EMA SMA WMA HMA with Directional Color Change
Description:
This is a Swiss Army knife type of Moving Average tool. Select your favorite Moving Average type, EMA - Exponential Moving Average, SMA - Simple Moving Average, WMA - Weighted Moving Average, or HMA - Hull Moving Average. Then selection your number of periods. The MA line is green when trending higher and red when trending lower. The fill between price and the MA line matches the red/green of the direction.
Defaults and Configuration:
The default setting is 65 period and EMA. Line colors and optional fill colors are user-configurable.
Alerts:
An alert can be set on the MA for directional color changes (red to green, or green to red) Right click the indicator and select Add Alert. Then select Bullish or Bearish color change.
Suggested Uses:
Add this to any timeframe chart with your favorite Moving averages. A strategy I use frequently is to "stretch" the Moving average. For example if you like the 8 day moving average on the daily chart, try the 52 period Moving average on the hourly chart. (6.5 market hours per day * 8) By looking at smaller time frames with longer MAs you get smoother color transitions on the Moving average. Add multiple instances of the MA. I prefer to use a smaller quick MA with a longer MA that represents a longer time frame.
Another use case I also like is the color transition over a Moving Average crossover. While I do like the daily 2/6 and 8/3 moving average crossovers, red-to-green and green-to-red color transitions seem to work with less lag than the crossovers.
Suggested Settings:
Daily charts: 8 EMA
Hourly charts: 55 EMA
30 minute charts: 65 WMA. (I like this one for inverse ETFs)
3 minutes charts: 178 EMA and 233 EMA
I also like to round MA settings up or down to the nearest fibonacci number: 5, 8, 13, 21, 34, 55, 89, 144, 233, 377, etc.

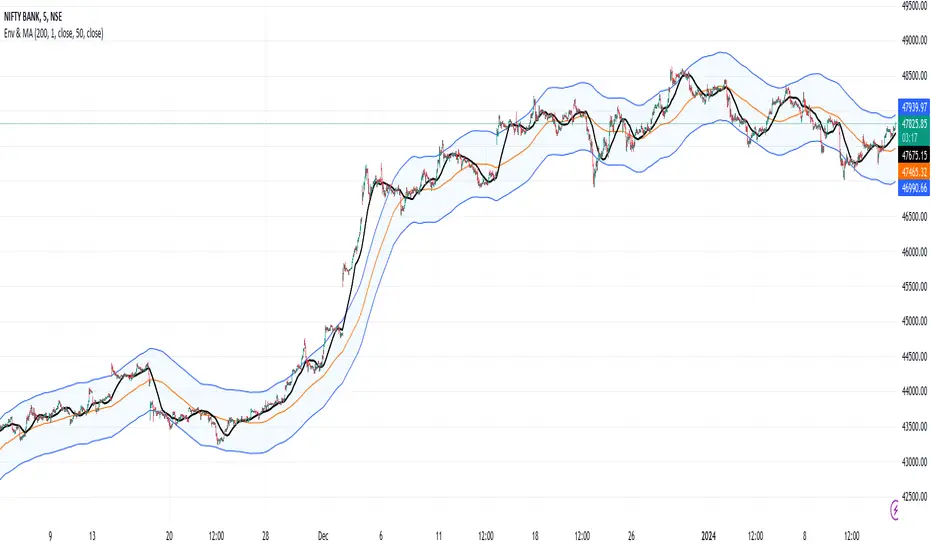
Envelope and Moving Average**Description:**
- This script creates an indicator that combines an envelope and a simple moving average (MA).
- The envelope is constructed using a specified length, percentage deviation, and source price (close by default).
- The moving average is calculated based on a specified length and source price.
**Inputs:**
1. Envelope:
- Length: Number of periods used for the envelope calculation (default is 20).
- Percentage Deviation: Percentage above and below the envelope basis (default is 10%).
- Source: The price used for the envelope calculation (default is close).
- Exponential MA: Option to use exponential moving average for the envelope basis (default is false).
2. Moving Average:
- Length: Number of periods used for the moving average calculation (default is 20).
- Source: The price used for the moving average calculation (default is close).
**Plotting:**
- The script plots the envelope basis, upper envelope line, and lower envelope line.
- The area between the upper and lower envelope lines is filled with a semi-transparent color for better visualization.
- The moving average is plotted on the chart with a specified color and line width.
**How to Use in a Strategy:**
1. **Envelope Crossovers:**
- Go Long (Buy): When the close price crosses above the upper envelope line.
- Go Short (Sell): When the close price crosses below the lower envelope line.
2. **Moving Average Crossovers:**
- Go Long (Buy): When the close price crosses above the moving average.
- Go Short (Sell): When the close price crosses below the moving average.
3. **Confirmation:**
- Consider additional confirmation signals or filters to improve the robustness of your strategy.
- For example, you might require a certain amount of price momentum or use other technical indicators in conjunction with envelope and moving average signals.
4. **Optimization:**
- Experiment with different parameter values (e.g., envelope length, percentage deviation, moving average length) to optimize the strategy for specific market conditions.
5. **Risk Management:**
- Implement proper risk management techniques, such as setting stop-loss orders and position sizing, to control risk.
Remember to thoroughly backtest any strategy before deploying it in a live trading environment. Additionally, consider the current market conditions and adapt your strategy accordingly.
Ingenious SMA CrossoverIntroduction
A popular use for moving averages is to develop simple trading systems based on moving average crossovers. A trading system using two moving averages would give a buy signal when the shorter (faster) moving average advances above the longer (slower) moving average. A sell signal would be given when the shorter moving average crosses below the longer moving average. The speed of the systems and the number of signals generated will depend on the period of the moving averages.
What is this tool?
This tool is a crossover system of two simple moving averages. I called it "Ingenious" because it uses a decision tree-based algorithm under the hood to find and plot the most profitable SMA combination.
It analyzes the range of periods between 4 to 45 and backtests each combination across the entire history of an instrument. If the more profitable periods were detected the indicator will switch periods of the moving averages to the found ones immediately.
NOTE : It does not change what has already been plotted.
Good luck!

RenKagi Fusion: Aura & SMA Clash IndicatorRenKagi Fusion: Aura & SMA Clash Indicator
Welcome to the RenKagi Fusion Indicator – a powerful, customizable tool that blends the strengths of Renko and Kagi charts to provide noise-filtered trend insights, enhanced with visual Aura effects and SMA (Simple Moving Average) crossover signals. Designed for traders seeking a unique edge in trend detection and reversal identification, this indicator combines traditional charting techniques with modern visualizations to help you navigate markets more effectively. Whether you're trading stocks, forex, or crypto, RenKagi Fusion offers a clean, actionable overview of market dynamics.
Key Features
RenKagi Line (Weighted Fusion of Renko and Kagi): The core of the indicator is the RenKagi line, a weighted average of Renko (brick-based trend filtering) and Kagi (reversal-focused line charts). Users can adjust the weight (default: 60% Renko, 40% Kagi) to prioritize stability or sensitivity. This fusion reduces market noise while highlighting key price movements.
Trend Scoring System: Calculates strength scores for Renko, Kagi, and RenKagi (capped at 20 points, converted to percentages). Scores increase with trend continuation and reset on reversals, giving a quantitative measure of momentum.
Aura Effects (Optional): Visual "glow" around lines based on score percentage – higher scores mean more opaque and thicker auras, adding a dynamic layer to trend visualization.
SMA Clash (Crossover Detection): Monitors daily SMA50, SMA100, and SMA200 for golden/death crosses (SMA50 crossing above/below longer SMAs) and RenKagi-SMA crossovers. These are displayed in a persistent info table for quick reference.
Customizable Visuals: Toggle lines, boxes, shapes, auras, and labels. Background coloring based on selected source (Renko, Kagi, or RenKagi) for intuitive trend bias.
Info Table: A configurable table (position and colors adjustable) summarizing scores, directions, cross states, brick size (with type), Kagi reversal (with type), and weights. No clutter – all in one place.
Alert Conditions: Built-in alerts for direction changes (Renko, Kagi, RenKagi), SMA crossovers, and golden/death crosses – perfect for real-time notifications.
How It Works
Renko Logic: Builds bricks based on user-selected type (Traditional fixed size, ATR dynamic, or Percentage). Scores build as trends persist, resetting on reversals.
Kagi Logic: Line reverses on thresholds (Traditional, ATR, or Percentage), scoring continuous moves.
RenKagi Calculation: Weighted average: (renkoPrice * renkoWeight + kagiLine * (100 - renkoWeight)) / 100. Score is a blend of individual scores.
SMA Integration: Daily timeframe SMAs for reliable long-term signals. Crossovers trigger alerts and update table states persistently until reversed.
Advantages for Traders
Noise Reduction: By fusing Renko's block structure with Kagi's reversal focus, it filters out minor fluctuations, helping identify strong trends early.
Versatility: Fully customizable – adjust weights, types, and visuals to fit any market or timeframe. Ideal for swing trading, trend following, or scalping.
Visual Clarity: Aura and background coloring provide at-a-glance insights, while the table consolidates data without overwhelming the chart.
Actionable Signals: Golden/Death crosses and direction changes offer clear entry/exit points, backed by alerts for timely execution.
Performance Optimization: Limits on lines/labels/boxes (500 each) ensure smooth operation on large datasets.
Usage Tips
Start with default settings for balanced performance.
Use in higher timeframes for trend confirmation or lower for intraday signals.
Combine with your favorite strategies – e.g., buy on RenKagi upward cross with SMA50 and golden cross confirmation.
Test on historical data to optimize weights and thresholds.
Note: This indicator is for educational and informational purposes only. Past performance is not indicative of future results. Always conduct your own analysis and use risk management. No financial advice is provided.
If you find this useful, please like, comment, or share your feedback!

Composite Trend Trader Module [BackQuant]Composite Trend Trader Module
Overview and Purpose
The Composite Trend Trader Module (CTM) is an invite-only Pine Script indicator designed to provide traders with a comprehensive tool for trend-following, dip-buying, and market strength assessment. By integrating multiple market data inputs—price momentum, volatility, volume, and statistical baselines—the CTM generates actionable outputs for trend identification, swing trade entries, and dip-buying opportunities. The indicator is intended for traders seeking a systematic approach to market analysis with customizable settings, while maintaining simplicity in its user interface. As a closed-source script, the underlying calculations remain proprietary, but this description outlines its functionality, features, and practical applications in trading.
Visual Components
The CTM provides the following visual elements on the chart:
• Signal Spine – A colored line (default 25-period weighted moving average) that reflects the dominant trend—green for bullish, red for bearish, and grey for neutral or transitional periods.
• Swing Triggers – Unicode markers ("𝕃" for long, "𝕊" for short) appear below or above bars when the trend shifts, signaling potential swing trade entries.
• Dip-Hunter Signals – Green arrows mark dip-buying opportunities, accompanied by faint green background highlights and forward-projecting entry lines for precise entry levels.
• Heat Meter – A horizontal strip at the bottom of the chart, graded from -50 (overheated) to +50 (deep dip), visually indicates the strength of dip conditions using a red-to-green gradient.
Core Features
The CTM comprises several components that work together to deliver a cohesive trading framework. Below is a detailed explanation of each, without disclosing proprietary calculations.
1. Universal Trend Tracking (UTT)
The UTT combines multiple momentum and statistical indicators into a single composite score ranging from -1 to +1. This score is derived from:
• Price-based momentum metrics.
• Volatility-adjusted thresholds.
• Statistical measures of price deviation and market structure.
When the UTT score exceeds +0.2, the market is considered in an actionable uptrend; below -0.2, a downtrend is identified. Values between these thresholds indicate a neutral or choppy market, helping traders avoid low-probability setups during consolidation.
2. Signal Spine
The signal spine is a 25-period weighted moving average of price, colored according to the UTT score (green for bullish, red for bearish, grey for neutral). This line serves as a visual anchor for tracking the prevailing trend and highlights regime changes in real time, enabling traders to align their strategies with market direction.
3. Swing Triggers (𝕃/𝕊)
Swing trade signals are generated when the UTT crosses the zero line, indicating a shift in market regime. A "𝕃" marker appears below the bar for a bullish crossover (potential long entry), and a "𝕊" marker appears above for a bearish crossover (potential short entry). These signals incorporate volatility-adaptive thresholds to minimize false triggers during low-volatility periods, improving reliability compared to traditional moving-average crossovers.
4. Dip-Hunter Engine
The Dip-Hunter subsystem identifies high-probability dip-buying opportunities by evaluating five conditions:
• Dip Magnitude – The price must have fallen by a user-defined percentage (default 2%) from a recent swing high, calculated over a specified lookback period (default 5 bars).
• Volume Burst – Current volume must exceed the average volume over a user-defined lookback (default 65 bars) by a specified multiplier (default 2x).
• Volatility Spike – The intraday range or Average True Range (ATR) must exceed a statistical baseline by a user-defined multiplier (default 1.5x).
• Structural Permission – Price must be below a fast Exponential Moving Average (EMA, default 20 periods), and the market structure must be bearish (fast EMA below slow EMA, default 50 periods).
• Trend Filter (Optional) – When enabled, dip signals are only generated if the UTT indicates a bullish trend, preventing trades against a bearish macro environment.
When these conditions align, the Dip-Hunter plots a green arrow, highlights the candle background, and draws a forward-projecting horizontal line at a user-selected price level (Low, Close, or calculated dip percentage).
5. Strength Score and Heat Meter
Each bar is assigned a strength score (0 to 5, or -50 to +50 when scaled for the heat meter) based on the following criteria:
• +1 for meeting the dip threshold.
• +1 for a volume spike.
• +1 for a volume momentum spike (based on rate-of-change).
• +1 for a confirmed volatility spike.
• +1 if price is below the fast EMA.
• +2 if the macro trend filter is bullish (when enabled).
The heat meter visualizes this score as a pointer on a red-to-green gradient strip, enabling traders to quickly assess the intensity of dip conditions and prioritize high-quality setups.
6. Entry-Line Generator
For each dip signal, the CTM draws a forward-projecting horizontal line to mark potential entry levels. Traders can configure:
• The price level for the line (Low, Close, or exact dip percentage).
• The duration of the line (default 100 bars).
• A minimum gap between signals (default 5 bars) to prevent overlapping lines during clustered events.
These lines serve as visual guides for setting limit orders or stop-loss levels.
7. Alerts
The CTM includes seven pre-configured alert conditions to support automated workflows:
• CTM Long/Short – Triggered on bullish or bearish UTT zero-line crossovers for swing trades.
• Market Overheated – Activates when the strength score falls below -40, indicating potential exhaustion.
• Close to Dip – Signals when the strength score reaches 0.6, suggesting an impending dip opportunity.
• Dip Confirmed – Fires on the first bar meeting all dip conditions.
• Dip Active – Triggers while dip conditions remain valid.
• Dip Fading – Activates when the strength score crosses below 0.5, indicating a weakening dip.
• Trend-Blocked – Alerts when dip conditions are met but blocked by the trend filter.
These alerts can be routed to brokers or trading bots for seamless execution.
"CPM Long Signal {{exchange}}:{{ticker}}")
"CPM Short Signal {{exchange}}:{{ticker}}")
"Market overheated {{ticker}}")
"Close to a dip {{ticker}}")
"Dip confirmed {{ticker}}")
"Dip active {{ticker}}")
"Dip strength fading {{ticker}}")
"Signal blocked by trend filter {{ticker}}")
User Controls
The CTM offers extensive customization to adapt to different trading styles and preferences:
• Signal Settings – Toggle the signal spine, composite score plot, swing triggers, and bar coloring. Adjust line width for visibility.
• Display Settings – Customize bullish, bearish, and neutral colors to match chart templates.
• Dip-Hunter Settings – Configure volume lookback, spike multipliers, EMA periods, volatility thresholds, dip percentage, and lookback bars.
• Trend Filter – Enable or disable the requirement for a bullish UTT before dip signals are generated.
• Strength & Meter – Toggle bar coloring based on the strength score, adjust the number of meter cells (default 60), and select meter position (e.g., bottom-center).
• Entry Settings – Control entry line visibility, length, and price source (Low, Close, or dip percentage).
Trading Applications
The CTM supports multiple trading strategies, each leveraging its outputs for specific market conditions:
• Trend-Ride Mode – Trade in the direction of the signal spine. Enter long positions on the first "𝕃" marker in a green (bullish) regime, and scale out when the UTT returns to grey (neutral). This is ideal for trend-following traders seeking to capture sustained moves, with the first signal in a new trend regime offering high statistical expectancy.
• Forced Dip Entries – Enable the trend filter and focus on dip signals (green arrows). Place limit orders at the entry line, set stops below the line, and target the midpoint of the prior value area (e.g., using support/resistance levels). This suits mean-reversion traders aiming to buy dips in bullish trends, with clear risk management via entry lines.
• Scalp Confirmation – Hide the signal spine and use bar coloring to identify short-term momentum. Green bars indicate broad buying pressure, while red bars warn against long scalps in oversold conditions. This is useful for intraday scalpers seeking confirmation of momentum before entering trades.
• Event Guardrails – Avoid trading when the heat meter is below -40 before major economic releases (e.g., FOMC, CPI), as spreads and slippage may widen. This enhances risk management by flagging high-risk periods during macroeconomic events.
• Multi-Timeframe Analysis – Apply the CTM on a daily timeframe in a secondary pane and a lower timeframe (e.g., hourly) on the primary chart. Trade only when both timeframes align (e.g., both in bullish regimes). This increases conviction for swing or position traders by confirming trend alignment across timeframes.
Frequently Asked Questions
• How does the CTM differ from a moving-average ribbon? The CTM integrates multiple momentum, volatility, and statistical indicators, using adaptive thresholds and proprietary calculations to respond faster to structural changes while filtering noise more effectively than traditional dual-EMA systems.
• Can the underlying formulas be accessed? No, the script is closed-source, and calculations are protected to preserve intellectual property. Users receive all outputs, alerts, and customizable parameters.
• Does the indicator repaint? No, all calculations use confirmed historical data without look-ahead bias. Entry lines are static from the signal bar.
• Which markets is it suitable for? The CTM is optimized for equities, futures, and cryptocurrencies. Adjust dip percentage and volume multipliers for low-liquidity markets.
• What about latency? The script uses efficient Pine Script functions and lightweight loops, ensuring minimal performance impact.
Limitations and Best Practices
• Market-Specific Tuning – Thinly traded markets may require adjustments to dip percentage and volume thresholds to avoid excessive signals.
• Complementary Tools – Combine the CTM with price action, support/resistance levels, or order flow analysis to confirm signals and avoid over-reliance on the indicator.
• Event Risk – Be cautious during high-impact news events, as volatility spikes may trigger signals that are quickly reversed.
• Trend Filter Use – Enabling the trend filter reduces false dip signals in bearish markets but may delay entries in rapidly reversing markets.
Conclusion
The Composite Trend Trader Module consolidates trend-following, dip-buying, and strength assessment into a single, customizable indicator. By providing clear visual cues, actionable alerts, and flexible settings, it equips traders with a robust framework for navigating various market conditions. While the proprietary calculations remain protected, the CTM’s outputs enable traders to make informed decisions, align strategies with market regimes, and manage risk effectively. Use it as a strategic tool alongside sound risk management and complementary analysis for optimal results.

RAMS TrapMaster ConfluenceOverview:
The TrapMaster Confluence indicator is a tactical multi-factor confirmation system designed to identify high-probability intraday and swing trade setups. It aligns multiple technical signals—momentum, trend, volume, and price action—to generate a clear bias score. By requiring confluence across several dimensions, it filters out weak or noisy signals and highlights trades with broader technical agreement. This tool is tailored for semi-advanced retail traders across equities, futures, and crypto who seek objective, structured confirmations before entering a position.
Confluence Components:
RSI (Relative Strength Index):
Evaluates momentum strength and trend bias. The script dynamically checks for crossovers at the 50 midline and extreme overbought/oversold zones to determine directional pressure.
MACD (Moving Average Convergence Divergence):
Detects momentum shifts using signal line crossovers and MACD histogram polarity. The script uses MACD direction and histogram flips to contribute to bullish or bearish pressure.
SMA 5 vs. SMA 20:
Captures short-term trend shifts via fast–slow moving average crossovers. A rising 5-SMA over a falling 20-SMA supports a bullish thesis and vice versa.
SMA 50 vs. SMA 200:
Used to confirm longer-term trend bias (e.g. golden cross or death cross) and add weight to the broader market structure.
SMA 5 Trend Direction:
Assesses immediate trend slope. An upward or downward slope of the 5-SMA confirms recent price acceleration or deceleration.
Volume Spike:
Flags high-volume price moves, helping validate whether momentum is supported by institutional participation or liquidity interest.
Rising Volume Bars:
Confirms directional strength through consistent increases in volume during trends. Sustained rising volume suggests growing conviction.
VWAP (Volume-Weighted Average Price):
Anchors price to institutional average cost per session. Price above VWAP typically indicates bullish sentiment; below signals bearish sentiment.
Candlestick Confirmation:
Confirms signals using recent price action (e.g. engulfing candles, breakouts with volume). Adds an extra layer of price behavior validation.
Contrarian Mode (Optional):
This feature flips the typical logic to catch high-probability reversal zones. When many signals align in one direction, contrarian mode allows the user to search for exhaustion points in sentiment or momentum, potentially capturing mean reversions.
Each confluence factor contributes a vote to a composite bias count. Users define a threshold (e.g., 4 out of 6 conditions) to trigger a signal. The indicator does not rely on any one signal, but instead rewards alignment across multiple technical aspects.
Signal Generation & Alerts:
When the defined confluence threshold is met, a signal label appears on the chart with directional context (long or short). Alerts can be tied to these signals, allowing the user to be notified in real time when actionable setups occur. The system supports “next candle confirmation,” which delays signal printing until the bar closes, minimizing premature alerts. All labels are limited to the most recent few to reduce chart clutter.
Dashboard Overview:
The optional real-time dashboard shows which confluence components are active on the current candle. This visual panel is customizable, updating dynamically and remaining hidden when no conditions are met. It includes:
Each factor with active/inactive status
Current bullish and bearish score counts
Real-time snapshot of bias development
Customization & Controls:
All components can be toggled on or off. Traders can choose to require stricter or looser confirmation thresholds. Label visibility, signal timing, and dashboard position/size are fully adjustable. This allows the indicator to adapt across timeframes and trading styles — whether scalping or swing trading.
Suggested Use with Trendlines and support and resistance:
TrapMaster becomes significantly more powerful when used alongside manual or automated support/resistance and trendline analysis. Confluence signals occurring near:
major support zones,
resistance levels,
trendline retests.
Fibonacci retracements,
help validate the price’s reaction to those areas. Traders can pre-mark key price zones, then use TrapMaster to confirm entries as momentum builds at those levels. This strengthens conviction and supports timing decisions when structure and indicators align.
Why It’s Different:
Most scripts offer a single signal or simplistic crossover logic. TrapMaster offers multi-dimensional logic that evaluates a comprehensive set of confluence factors—each customizable—with real-time logic that updates on every bar. The built-in dashboard provides a highly readable tactical summary. Its optional contrarian bias engine, dashboard visuals, factor-level customization, and risk-filtering logic (e.g. delayed confirmation and volume context) make it a flexible and advanced system not commonly found in traditional retail indicators.
Disclaimers:
This tool is for educational and analytical use only. It is not intended as trading or financial advice. All trading carries risk, and past performance is not indicative of future results. Always use proper risk management and conduct your own independent analysis before making trading decisions.
Developed by: TRAPPER-RAMS
Jul 24
Release Notes
This is the official update to RAMS TrapMaster Confluence, featuring massive enhancements across visual clarity, confluence accuracy, and real-time alert precision.
What's New:
Accurate Confluence Dashboard
Triple-row layout: Bullish , Bearish , and clear headers
Bull/Bear condition separation for total clarity
SMA 5/20 & 50/200 cross states tracked and displayed
Fully Integrated Alerts
Alerts for 5/20 and 50/200 SMA crosses
Bullish 💸 and Bearish 💰 confluence entry alerts
Instant trigger-ready setup
Visual Label Overhaul
💸 = Buy Signal (normal mode)
💰 = Sell Signal (normal mode)
🧨 = Contrarian Bull Flip
💣 = Contrarian Bear Flip
Cross labels show exact bar: "5/20 X", "50/200 X"
CoolDown & Memory-Efficient Label Logic
• Configurable label cooldown per N bars
• Old signals auto-deleted to prevent overflow
Use Cases:
This update is ideal for traders looking for precision entry timing, while understanding the full bull/bear backdrop in real-time.

Dynamic RSI Bollinger Bands with Waldo Cloud
TradingView Indicator Description: Dynamic RSI Bollinger Bands with Waldo Cloud
Title: Dynamic RSI Bollinger Bands with Waldo Cloud
Short Title: Dynamic RSI BB Waldo
Overview:
Introducing an experimental indicator, the Dynamic RSI Bollinger Bands with Waldo Cloud, designed for adventurous traders looking to explore new dimensions in technical analysis. This indicator overlays on your chart, providing a unique perspective by integrating the Relative Strength Index (RSI) with Bollinger Bands, creating a dynamic trading tool that adapts to market conditions through the lens of momentum and volatility.
What is it?
This innovative indicator combines the traditional Bollinger Bands with the RSI in a way that hasn't been commonly explored. Here's a breakdown:
RSI Integration: The RSI is calculated with customizable length settings, and its values are used not just for momentum analysis but as the basis for the Bollinger Bands. This means the position and width of the bands are directly influenced by the RSI, offering a visual representation of momentum within the context of price volatility.
Dynamic Bollinger Bands: Instead of using price directly, the Bollinger Bands are calculated using a scaled version of the RSI. This scaling is done to fit the RSI values into the price range, ensuring the bands are relevant to the actual price movement. The standard deviation for these bands is also scaled accordingly, providing a unique volatility measure that's momentum-driven.
Waldo Cloud: Named after a visual representation concept, the 'Waldo Cloud' refers to the colored area between the Bollinger Bands, which changes based on various conditions:
Purple when RSI is overbought.
Blue when RSI is oversold.
Green for bullish conditions, defined by the fast-moving average crossing above the slow one, RSI is bullish, and the price is above the slow MA.
Red for bearish conditions, when the fast MA crosses below the slow MA, the RSI is bearish, and the price is below the slow MA.
Gray for neutral market conditions.
Moving Averages: Two simple moving averages (Fast MA and Slow MA) are included, which can be toggled on or off, offering additional trend analysis through crossovers.
How to Use It:
Given its experimental nature, this indicator should be used with caution and in conjunction with other analysis methods:
Identifying Market Conditions: Use the color of the Waldo Cloud to gauge market sentiment. A green cloud might suggest a good time to consider long positions, while a red cloud could indicate potential shorting opportunities. Purple and blue clouds highlight extreme conditions that might precede reversals.
Volatility and Momentum: The dynamic nature of the Bollinger Bands based on RSI provides insight into how momentum is affecting price volatility. When the bands are wide, it might indicate high momentum and potential trend continuation or reversal, depending on the RSI's position relative to its overbought/oversold levels.
Trend Confirmation: The moving average crossovers can act as confirmation signals. For instance, a bullish crossover (fast MA over slow MA) within a green cloud might strengthen a buy signal, whereas a bearish crossover in a red cloud might reinforce a sell decision.
Customization: Adjust the RSI length, overbought/oversold levels, and moving average lengths to suit different trading styles or market conditions. Experiment with these settings to find what works best for your strategy.
Combining with Other Indicators: Since this is an experimental tool, it's advisable to use it alongside established indicators like traditional Bollinger Bands, MACD, or trend lines to validate signals.
Conclusion:
The Dynamic RSI Bollinger Bands with Waldo Cloud is an experimental venture into combining momentum with volatility visually and interactively. It's designed for traders who are open to exploring new methods of market analysis.
Remember, due to its experimental status, this indicator should be part of a broader trading strategy, and backtesting or paper trading is recommended before applying it in live trading scenarios. Keep an eye on how the market reacts to the signals provided by this indicator and always consider risk management practices.

Key Indicators Dashboard (KID)Key Indicators Dashboard (KID) — Comprehensive Market & Trend Metrics
📌 Overview
The Key Indicators Dashboard (KID) is an advanced multi-metric market analysis tool designed to consolidate essential technical, volatility, and relative performance data into a single on-chart table. Instead of switching between multiple indicators, KID centralizes these key measures, making it easier to assess a stock’s technical health, volatility state, trend status, and relative strength at a glance.
🛠 Key Features
⦿ Average Daily Range (ADR %): Measures average daily price movement over a specified period. It is calculated by averaging the daily price range (high - low) over a set number of days (default 20 days).
⦿ Average True Range (ATR): Measures volatility by calculating the average of a true range over a specific period (default 14). It helps traders gauge the typical extent of price movement, regardless of the direction.
⦿ ATR%: Expresses the Average True Range as a percentage of the price, which allows traders to compare the volatility of stocks with different prices.
⦿ Relative Strength (RS): Compares a stock’s performance to a chosen benchmark index (default NIFTYMIDSML400) over a specific period (default 50 days).
⦿ RS Score (IBD-style): A normalized 1–100 rating inspired by Investor’s Business Daily methodology.
How it works: The RS Score is based on a weighted average of price changes over 3 months (40%), 6 months (20%), 9 months (20%), and 12 months (20%).
The raw value is converted into a percentage return, then normalized over the past 252 trading days so the lowest value maps to 1 and the highest to 100.
This produces a percentile-style score that highlights the strongest stocks in relative terms.
⦿ Relative Volume (RVol): Compares a stock's current volume to its average volume over a specific period (default 50). It is calculated by dividing the current volume by the average historical volume.
⦿ Average ₹ Volume (Turnover): Represents the total monetary value of shares traded for a stock. It's calculated by multiplying a day's closing price by its volume, with the final value converted to crores for clarity. This metric is a key indicator of a stock's liquidity and overall market interest.
⦿ Moving Average Extension: Measures how far a stock's current price has moved from from a selected moving average (EMA or SMA). This deviation is normalized by the stock's volatility (ATR%), with a default threshold of 6 ATR used to indicate that the stock is significantly extended and is marked with a selected shape (default Red Flag).
⦿ 52-Weeks High & Low: Measures a stock's current price in relation to its highest and lowest prices over the past year. It calculates the percentage a stock is below its 52-week high and above its 52-week low.
⦿ Market Capitalization: Market Cap represents the total value of all outstanding.
⦿ Free Float: It is the value of shares readily available for public trading, with the Free Float Percentage showing the proportion of shares available to the public.
⦿ Trend: Uses Supertrend indicator to identify the current trend of a stock's price. A factor (default 3) and an ATR period (default 10) is used to signal whether the trend is up or down.
⦿ Minervini Trend Template (MTT): It is a set of technical criteria designed to identify stocks in strong uptrends.
Price > 50-DMA > 150-DMA > 200-DMA
200-DMA is trending up for at least 1 month
Price is at least 30% above its 52-week low.
Price is within at least 25 percent of its 52-week high
Table highlights when a stock meets all above criteria.
⦿ Sector & Industry: Display stock's sector and industry, provides categorical classification to assist sector-based analysis. The sector is a broad economic classification, while the industry is a more specific group within that sector.
⦿ Moving Averages (MAs): Plot up to four customizable Moving Averages on a chart. You can independently set the type (Simple or Exponential), the source price, and the length for each MA to help visualize a stock's underlying trend.
MA1: Default 10-EMA
MA2: Default 20-EMA
MA3: Default 50-EMA
MA4: Default 200-EMA
⦿ Moving Average (MA) Crossover: It is a trend signal that occurs when a shorter-term moving average crosses a longer-term one. This script identifies these crossover events and plots a marker on the chart to visually signal a potential change in trend direction.
User-configurable MAs (short and long).
A bullish crossover occurs when the short MA crosses above the long MA.
A bearish crossover occurs when the short MA crosses below the long MA.
⦿ Inside Bar (IB): An Inside Bar is a candlestick whose entire price range is contained within the range of the previous bar. This script identifies this pattern, which often signals consolidation, and visually marks bullish and bearish inside bars on the chart with distinct colors and labels.
⦿ Tightness: Identifies periods of low volatility and price consolidation. It compares the price range over a short lookback period (default 3) to the average daily range (ADR). When the lookback range is smaller than the ADR, the indicator plots a marker on the chart to signal consolidation.
⦿ PowerBar (Purple Dot): Identifies candles with a strong price move on high volume. By default, it plots a purple dot when a stock moves up or down by at least 5% and has a minimum volume of 500,000. More dots indicate higher volatility and liquidity.
⦿ Squeezing Range (SQ): Identifies periods of low volatility, which can often precede a significant price move. It checks if the Bollinger Bands have narrowed to a range that is smaller than the Average True Range (ATR) for a set number of consecutive bars (default 3).
(UpperBB - LowerBB) < (ATR × 2)
⦿ Mark 52-Weeks High and Low: Marks and labels a stock's 52-Week High and Low prices directly on the chart. It draws two horizontal lines extending from the candles where the highest and lowest prices occurred over the past year, providing a clear visual reference for long-term price extremes.
⏳PineScreener Filters
The indicator’s alert conditions act as filters for PineScreener.
Price Filter: Minimum and maximum price cutoffs (default ₹25 - ₹10000).
Daily Price Change Filter: Minimum and maximum daily percent change (default -5% and 5%).
🔔 Built-in Alerts
Supports alert creation for:
ADR%, ATR/ATR %, RS, RS Rating, Turnover
Moving Average Crossover (Bullish/Bearish)
Minervini Trend Template
52-Week High/Low
Inside Bars (Bullish/Bearish)
Tightness
Squeezing Range (SQ)
⚙️ Customizable Visualization
Switchable between vertical or horizontal layout.
Works in dark/light mode
User-configurable to toggle any indicator ON or OFF.
User-configurable Moving (EMA/SMA), Period/Lengths and thresholds.
⦿ (Optional) : For horizontal table orientation increase Top Margin to 16% in Chart (Canvas) settings to avoid chart overlapping with table.
⚡ Add this script to your chart and start making smarter trade decisions today! 🚀

RDBRB Strategy with Filters + Cooldowns + LabelsRDBRB Strategy with Filters + Cooldowns
This script implements the RDBRB (Rally-Drop-Base-Retest-Breakout) strategy, a classic price action setup designed to identify structured trade opportunities using volume, volatility bands, and trend alignment. It’s ideal for traders looking for clean, rule-based entries across any timeframe.
🧠 Core Components
Rally & Drop Detection
Identifies short-term momentum shifts using moving average crossovers:
✅ Ra = Rally (bullish crossover)
🔻 Dr = Drop (bearish crossunder)
Base Formation
A statistical base is defined using a moving average with a standard deviation envelope (Upper/Lower BB). This forms the foundation for breakout or retest setups.
Retest Zone (RT)
When price returns to the lower band (but stays below the base), it suggests a potential re-accumulation or reaction zone before a breakout.
Breakout Confirmation (BO)
A breakout is validated when:
Price crosses above the upper band
Volume exceeds the 20-bar average by a threshold multiplier
RSI is above a bullish momentum level
Price is trending above the longer-term EMA
⏱️ Smart Cooldown Logic
Each signal (Rally, Drop, Retest, Breakout) has an independent cooldown timer to prevent multiple triggers within a short range, filtering out noise and duplicate signals:
Customizable cooldown periods via input settings
Ensures signals are meaningful and not clustered
💡 Visual Markers
All signals are shown as small, color-coded labels:
Ra : Green label below bar
Dr : Red label above bar
RT : Yellow label below bar
BO : Green breakout label below bar
Bands and base are plotted for structure reference.
🛠️ Customizable Settings
Cooldown periods for each signal type
MA lengths, volume and RSI thresholds
Trend filter and base calculation inputs
This script is ideal for price action traders who want a clean, structured method to trade consolidations and trend continuations while avoiding over-signaling. Use it on any timeframe and combine with higher-timeframe confirmation for best results.
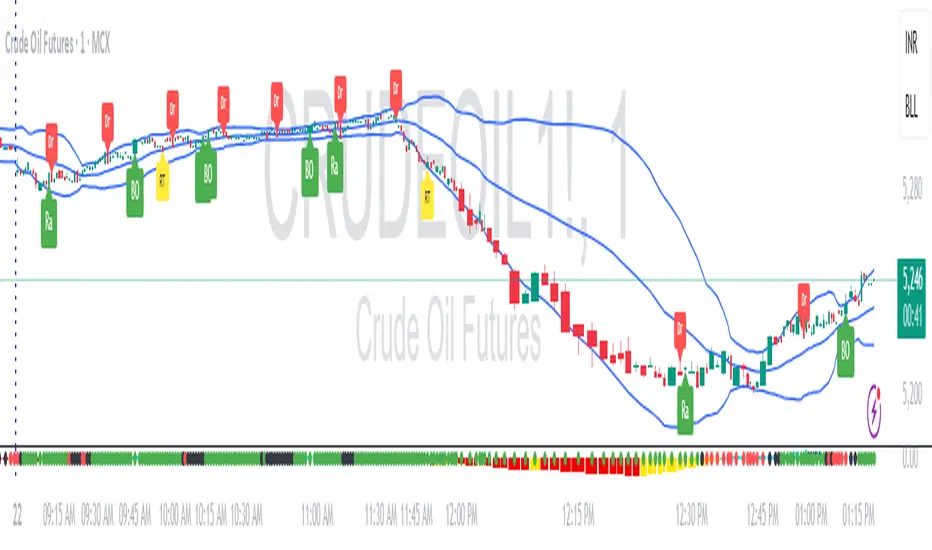
Multi-Symbol Trend DashboardMulti-Symbol Trend Dashboard - MA Cross Trend Monitor
Short Description
A customizable dashboard that displays trend direction across multiple symbols and timeframes using moving average crossovers.
Full Description
Overview
This Multi-Symbol Trend Dashboard allows you to monitor trend direction across 7 different symbols and 5 timeframes simultaneously in a single view. The dashboard uses moving average crossovers to determine trend direction, displaying bullish trends in green and bearish trends in red.
Key Features
Multi-Symbol Monitoring : Track up to 7 different trading instruments at once
Multi-Timeframe Analysis: View 5 different timeframes simultaneously for each instrument
Customizable Moving Averages: Choose between SMA, EMA, or WMA with adjustable periods
Visual Clarity: Color-coded cells provide immediate trend identification
Flexible Positioning: Place the dashboard anywhere on your chart
Customizable Appearance: Adjust sizes, colors, and text formatting
How It Works
The dashboard calculates a fast MA and slow MA for each symbol-timeframe combination. When the fast MA is above the slow MA, the cell shows green (bullish). When the fast MA is below the slow MA, the cell shows red (bearish).
Use Cases
Get a bird's-eye view of market trends across multiple instruments
Identify potential trading opportunities where multiple timeframes align
Monitor your watchlist without switching between charts
Spot divergences between related instruments
Track market breadth across sectors or related instruments
Notes and Limitations
Limited to 7 symbols and 5 timeframes due to TradingView's security request limits
Uses simple MA crossover as trend determination method
Dashboard is most effective when displayed on a dedicated chart
Performance may vary on lower-end devices due to multiple security requests
Settings Explanation
MA Settings: Configure the periods and types of moving averages
Display Settings: Adjust dashboard positioning and visual elements
Trading Instruments: Select which symbols to monitor (defaults to major forex pairs)
Timeframes: Choose which timeframes to display (default: M15, H1, H4, D1, W1)
Colors: Customize the color scheme for bullish/bearish indications and headers
This dashboard provides a straightforward way to maintain situational awareness across multiple markets and timeframes, helping traders identify potential setups and market conditions at a glance.

Dual Momentum OSCOverview:
Momentum OSC is a dual-layered momentum oscillator that blends multi-timeframe momentum readings with moving average crossovers for deeper insight into trend acceleration and exhaustion. Perfect for confirming trend strength or spotting early shifts in momentum.
Features:
✅ Two separate momentum streams with customizable timeframes
✅ Smoothing via moving averages for both momenta
✅ Cross-timeframe momentum structure for confirmation and divergence
✅ Color-coded areas for intuitive visual interpretation
✅ Optional crossover markers to signal bullish/bearish momentum shifts
How It Works:
The script calculates two momentum values by comparing current price sources against lagged values across separate timeframes. Each is smoothed with a moving average to filter noise. The difference between momentum and its moving average forms a core component of trend strength confirmation. Optional visual circles mark bullish or bearish crossovers.
Customizable Inputs:
Timeframes, sources, lengths, and MA periods for both momentum streams
Toggle to display momentum cross signals (circles)
Works on any asset or timeframe

MTF Signal XpertMTF Signal Xpert – Detailed Description
Overview:
MTF Signal Xpert is a proprietary, open‑source trading signal indicator that fuses multiple technical analysis methods into one cohesive strategy. Developed after rigorous backtesting and extensive research, this advanced tool is designed to deliver clear BUY and SELL signals by analyzing trend, momentum, and volatility across various timeframes. Its integrated approach not only enhances signal reliability but also incorporates dynamic risk management, helping traders protect their capital while navigating complex market conditions.
Detailed Explanation of How It Works:
Trend Detection via Moving Averages
Dual Moving Averages:
MTF Signal Xpert computes two moving averages—a fast MA and a slow MA—with the flexibility to choose from Simple (SMA), Exponential (EMA), or Hull (HMA) methods. This dual-MA system helps identify the prevailing market trend by contrasting short-term momentum with longer-term trends.
Crossover Logic:
A BUY signal is initiated when the fast MA crosses above the slow MA, coupled with the condition that the current price is above the lower Bollinger Band. This suggests that the market may be emerging from a lower price region. Conversely, a SELL signal is generated when the fast MA crosses below the slow MA and the price is below the upper Bollinger Band, indicating potential bearish pressure.
Recent Crossover Confirmation:
To ensure that signals reflect current market dynamics, the script tracks the number of bars since the moving average crossover event. Only crossovers that occur within a user-defined “candle confirmation” period are considered, which helps filter out outdated signals and improves overall signal accuracy.
Volatility and Price Extremes with Bollinger Bands
Calculation of Bands:
Bollinger Bands are calculated using a 20‑period simple moving average as the central basis, with the upper and lower bands derived from a standard deviation multiplier. This creates dynamic boundaries that adjust according to recent market volatility.
Signal Reinforcement:
For BUY signals, the condition that the price is above the lower Bollinger Band suggests an undervalued market condition, while for SELL signals, the price falling below the upper Bollinger Band reinforces the bearish bias. This volatility context adds depth to the moving average crossover signals.
Momentum Confirmation Using Multiple Oscillators
RSI (Relative Strength Index):
The RSI is computed over 14 periods to determine if the market is in an overbought or oversold state. Only readings within an optimal range (defined by user inputs) validate the signal, ensuring that entries are made during balanced conditions.
MACD (Moving Average Convergence Divergence):
The MACD line is compared with its signal line to assess momentum. A bullish scenario is confirmed when the MACD line is above the signal line, while a bearish scenario is indicated when it is below, thus adding another layer of confirmation.
Awesome Oscillator (AO):
The AO measures the difference between short-term and long-term simple moving averages of the median price. Positive AO values support BUY signals, while negative values back SELL signals, offering additional momentum insight.
ADX (Average Directional Index):
The ADX quantifies trend strength. MTF Signal Xpert only considers signals when the ADX value exceeds a specified threshold, ensuring that trades are taken in strongly trending markets.
Optional Stochastic Oscillator:
An optional stochastic oscillator filter can be enabled to further refine signals. It checks for overbought conditions (supporting SELL signals) or oversold conditions (supporting BUY signals), thus reducing ambiguity.
Multi-Timeframe Verification
Higher Timeframe Filter:
To align short-term signals with broader market trends, the script calculates an EMA on a higher timeframe as specified by the user. This multi-timeframe approach helps ensure that signals on the primary chart are consistent with the overall trend, thereby reducing false signals.
Dynamic Risk Management with ATR
ATR-Based Calculations:
The Average True Range (ATR) is used to measure current market volatility. This value is multiplied by a user-defined factor to dynamically determine stop loss (SL) and take profit (TP) levels, adapting to changing market conditions.
Visual SL/TP Markers:
The calculated SL and TP levels are plotted on the chart as distinct colored dots, enabling traders to quickly identify recommended exit points.
Optional Trailing Stop:
An optional trailing stop feature is available, which adjusts the stop loss as the trade moves favorably, helping to lock in profits while protecting against sudden reversals.
Risk/Reward Ratio Calculation:
MTF Signal Xpert computes a risk/reward ratio based on the dynamic SL and TP levels. This quantitative measure allows traders to assess whether the potential reward justifies the risk associated with a trade.
Condition Weighting and Signal Scoring
Binary Condition Checks:
Each technical condition—ranging from moving average crossovers, Bollinger Band positioning, and RSI range to MACD, AO, ADX, and volume filters—is assigned a binary score (1 if met, 0 if not).
Cumulative Scoring:
These individual scores are summed to generate cumulative bullish and bearish scores, quantifying the overall strength of the signal and providing traders with an objective measure of its viability.
Detailed Signal Explanation:
A comprehensive explanation string is generated, outlining which conditions contributed to the current BUY or SELL signal. This explanation is displayed on an on‑chart dashboard, offering transparency and clarity into the signal generation process.
On-Chart Visualizations and Debug Information
Chart Elements:
The indicator plots all key components—moving averages, Bollinger Bands, SL and TP markers—directly on the chart, providing a clear visual framework for understanding market conditions.
Combined Dashboard:
A dedicated dashboard displays key metrics such as RSI, ADX, and the bullish/bearish scores, alongside a detailed explanation of the current signal. This consolidated view allows traders to quickly grasp the underlying logic.
Debug Table (Optional):
For advanced users, an optional debug table is available. This table breaks down each individual condition, indicating which criteria were met or not met, thus aiding in further analysis and strategy refinement.
Mashup Justification and Originality
MTF Signal Xpert is more than just an aggregation of existing indicators—it is an original synthesis designed to address real-world trading complexities. Here’s how its components work together:
Integrated Trend, Volatility, and Momentum Analysis:
By combining moving averages, Bollinger Bands, and multiple oscillators (RSI, MACD, AO, ADX, and an optional stochastic), the indicator captures diverse market dynamics. Each component reinforces the others, reducing noise and filtering out false signals.
Multi-Timeframe Analysis:
The inclusion of a higher timeframe filter aligns short-term signals with longer-term trends, enhancing overall reliability and reducing the potential for contradictory signals.
Adaptive Risk Management:
Dynamic stop loss and take profit levels, determined using ATR, ensure that the risk management strategy adapts to current market conditions. The optional trailing stop further refines this approach, protecting profits as the market evolves.
Quantitative Signal Scoring:
The condition weighting system provides an objective measure of signal strength, giving traders clear insight into how each technical component contributes to the final decision.
How to Use MTF Signal Xpert:
Input Customization:
Adjust the moving average type and period settings, ATR multipliers, and oscillator thresholds to align with your trading style and the specific market conditions.
Enable or disable the optional stochastic oscillator and trailing stop based on your preference.
Interpreting the Signals:
When a BUY or SELL signal appears, refer to the on‑chart dashboard, which displays key metrics (e.g., RSI, ADX, bullish/bearish scores) along with a detailed breakdown of the conditions that triggered the signal.
Review the SL and TP markers on the chart to understand the associated risk/reward setup.
Risk Management:
Use the dynamically calculated stop loss and take profit levels as guidelines for setting your exit points.
Evaluate the provided risk/reward ratio to ensure that the potential reward justifies the risk before entering a trade.
Debugging and Verification:
Advanced users can enable the debug table to see a condition-by-condition breakdown of the signal generation process, helping refine the strategy and deepen understanding of market dynamics.
Disclaimer:
MTF Signal Xpert is intended for educational and analytical purposes only. Although it is based on robust technical analysis methods and has undergone extensive backtesting, past performance is not indicative of future results. Traders should employ proper risk management and adjust the settings to suit their financial circumstances and risk tolerance.
MTF Signal Xpert represents a comprehensive, original approach to trading signal generation. By blending trend detection, volatility assessment, momentum analysis, multi-timeframe alignment, and adaptive risk management into one integrated system, it provides traders with actionable signals and the transparency needed to understand the logic behind them.

Moving Average Multitool CrossoverAs per request, this is a moving average crossover version of my original moving average multitool script .
It allows you to easily access and switch between different types of moving averages, without having to continuously add and remove different moving averages from your chart. This should make backtesting moving average crossovers much, much more easier. It also has the option to show buy and sell signals for the crossovers of the chosen moving averages.
It contains the following moving averages:
Exponential Moving Average (EMA)
Simple Moving Average (SMA)
Weighted Moving Average (WMA)
Double Exponential Moving Average (DEMA)
Triple Exponential Moving Average (TEMA)
Triangular Moving Average (TMA)
Volume-Weighted Moving Average (VWMA)
Smoothed Moving Average (SMMA)
Hull Moving Average (HMA)
Least Squares Moving Average (LSMA)
Kijun-Sen line from the Ichimoku Kinko-Hyo system (Kijun)
McGinley Dynamic (MD)
Rolling Moving Average (RMA)
Jurik Moving Average (JMA)
Arnaud Legoux Moving Average (ALMA)
Vector Autoregression Moving Average (VAR)
Welles Wilder Moving Average (WWMA)
Sine Weighted Moving Average (SWMA)
Leo Moving Average (LMA)
Variable Index Dynamic Average (VIDYA)
Fractal Adaptive Moving Average (FRAMA)
Variable Moving Average (VAR)
Geometric Mean Moving Average (GMMA)
Corrective Moving Average (CMA)
Moving Median (MM)
Quick Moving Average (QMA)
Kaufman's Adaptive Moving Average (KAMA)
Volatility-Adjusted Moving Average (VAMA)
Modular Filter (MF)
